Introducción de una nueva pantalla interactiva para comprender los cambios en las puntuaciones NAEP de los estados para estudiantes con puntuaciones más altas y bajas
La caída en el rendimiento estudiantil desde la pandemia de COVID-19 pone en peligro el avance de la sociedad en general. Visualizaciones de datos reflexivas pueden ayudar a revelar cómo les va a los estudiantes y quiénes son los que más necesitan apoyo adicional para estar preparados para el éxito tras el instituto.
En abril de 2025, la Junta Nacional de Gobierno de la Evaluación (NAGB) publicó una herramienta de datos NAEP para explorar cómo están avanzando la nación y los estados en el camino hacia la recuperación académica utilizando las puntuaciones de la Evaluación Nacional del Progreso Educativo (NAEP). La Figura 1 ofrece una instantánea de la herramienta. Destaca los cambios en las puntuaciones medias de una nota (4º o 8º) y de una asignatura (lectura o matemáticas) mediante gráficos de barras. La herramienta de datos ofrece un resumen de puntos clave, pero como mostramos en una reciente entrada del blog ETS Research, historias más completas de cambios en el rendimiento estudiantil suelen esconderse detrás de puntuaciones medias. O como dice el mantra: "¡Los promedios pueden ocultar más de lo que revelar!"
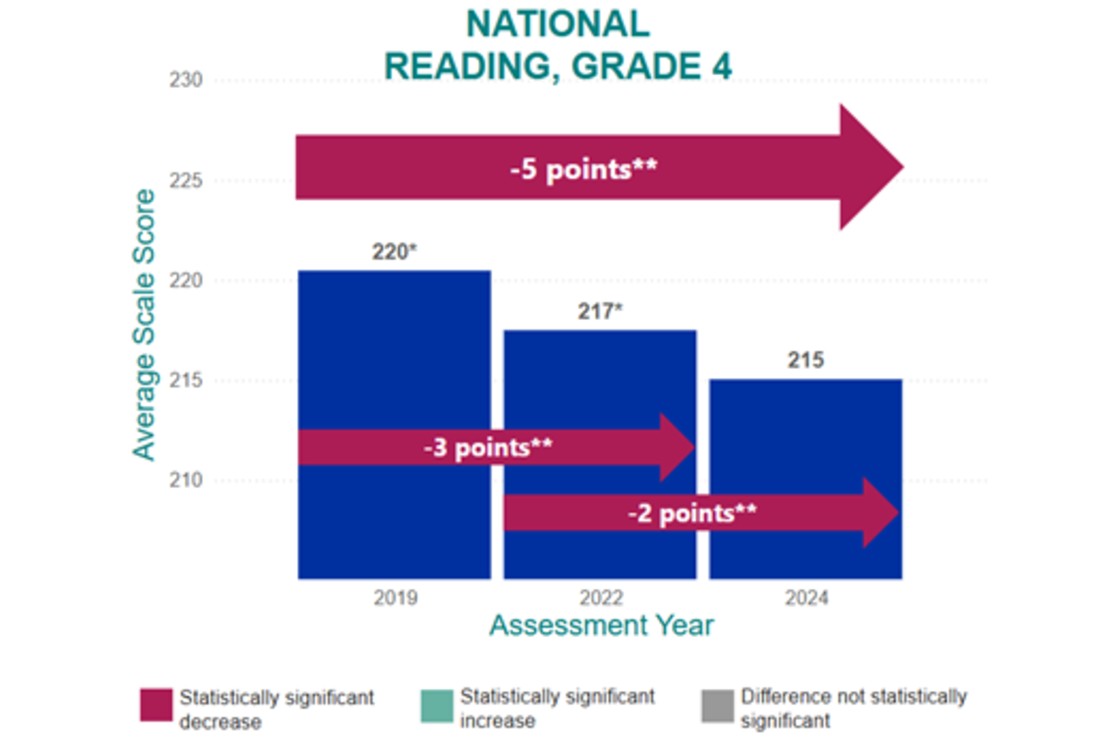
Figura 1. Reproducción del gráfico de barras de cambios de puntuación de la NAGB durante la pandemia para el país en lecturas de 4º curso.
Nos inspiramos para crear una pantalla interactiva que analizara los cambios de puntuación en todo el espectro de logros, porque si una imagen vale más que mil palabras, una pantalla interactiva vale muchas más. En esta entrada del blog, destacamos lo que esta nueva herramienta muestra sobre los cambios en el rendimiento estudiantil de antes y después de la pandemia en los 50 estados. Incluso en los estados que encabezan el ranking NAEP, los estudiantes con puntuaciones más bajas tienen más terreno que recuperar que sus compañeros con mejores puntuaciones. Luego revisamos la funcionalidad de nuestra pantalla interactiva para que puedas encontrar la siguiente historia en los datos.
Visualizar las distribuciones de puntuaciones es el primer paso para entender el rendimiento del alumnado
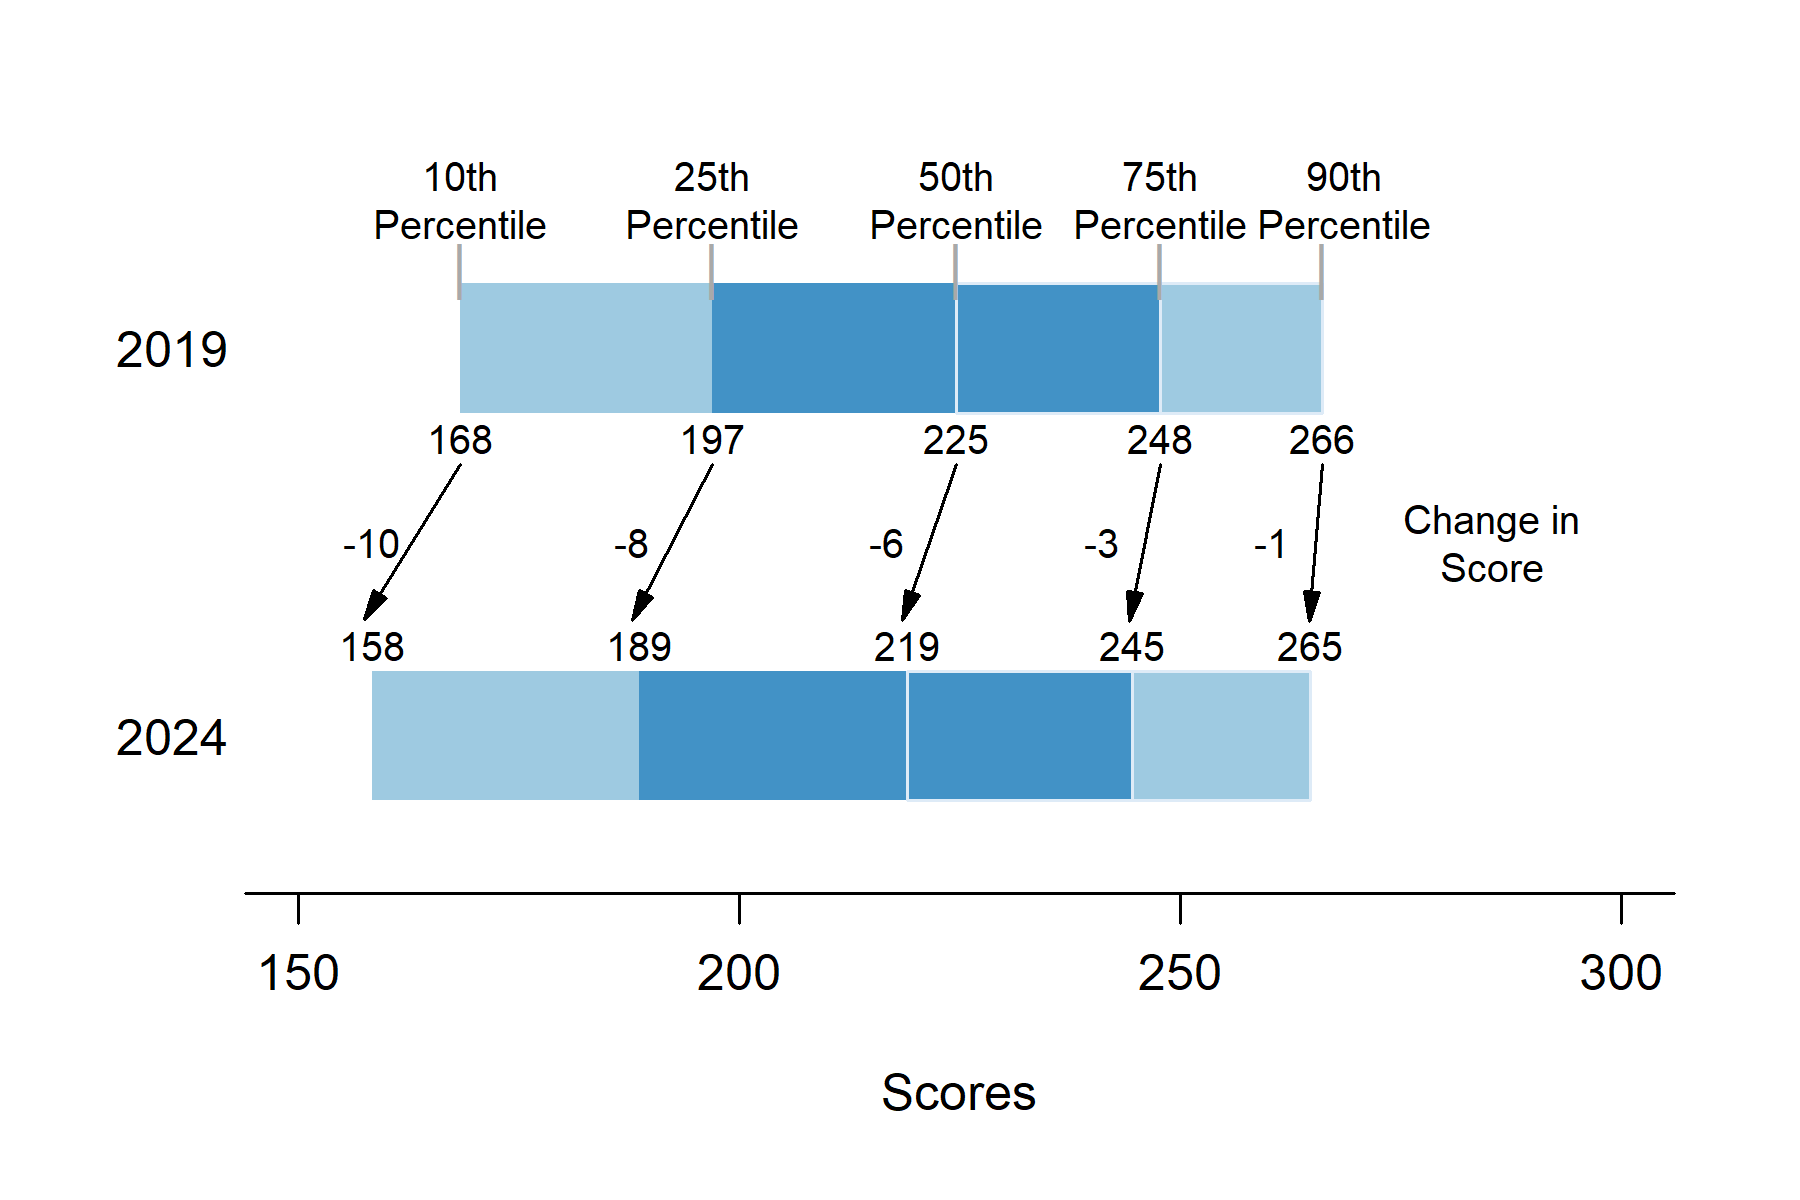
Figura 2. Distribuciones de las puntuaciones de lectura del NAEP de 4º grado 2019 y 2024 para todo el país.
En la Figura 2, utilizamos las distribuciones nacionales de puntuaciones de lectura de la NAEP de 4º grado para 2019 y 2024 para mostrar cómo cambiaron las puntuaciones de lectura desde antes hasta después de la pandemia. Para cada año, mostramos 5 puntos percentiales (disponibles en el NAEP Data Explorer), mostrando los puntos bajos (percentiles 10 y 25), medios (percentil 50) y altos (percentiles 75 y 90) del espectro de rendimiento estudiantil.
Comparar ambas distribuciones de puntuaciones nos muestra que, desde la pandemia, las puntuaciones bajaron más entre los estudiantes con puntuaciones más bajas que entre los que obtuvieron mejores puntuaciones. Esto se observa en la barra inferior, que representa la distribución de puntuaciones de 2024, que es más amplia que la de 2019. Se desplaza hacia la izquierda para los estudiantes con puntuaciones más bajas, pero está casi alineada con la distribución de puntuación de 2019 para los estudiantes con puntuaciones más altas. También hacemos estas observaciones:
- El 10 por ciento más bajo de los estudiantes obtuvo una puntuación igual o inferior a 168 en 2019, pero solo a 158 o por debajo en 2024—una bajada de 10 puntos.
- En cambio, el 10 por ciento superior de los estudiantes obtuvo una puntuación superior a 266 en 2019, frente a casi la misma puntuación de 265 en 2024, una caída de solo un punto.
- Utilizando la distribución completa de puntuaciones, en lugar de limitarnos a las puntuaciones medias, vemos que la disminución de los estudiantes con puntuaciones más bajas es unas 10 veces mayor que para los estudiantes con puntuaciones más altas.
- Estas diferencias en los cambios en las puntuaciones a lo largo del espectro de logro se traducen en que la disparidad de rendimiento entre estudiantes con baja y alta puntuación se amplíe en 9 puntos entre 2019 y 2024.
¿Cómo podemos mostrar este fenómeno preocupante con una sola línea?
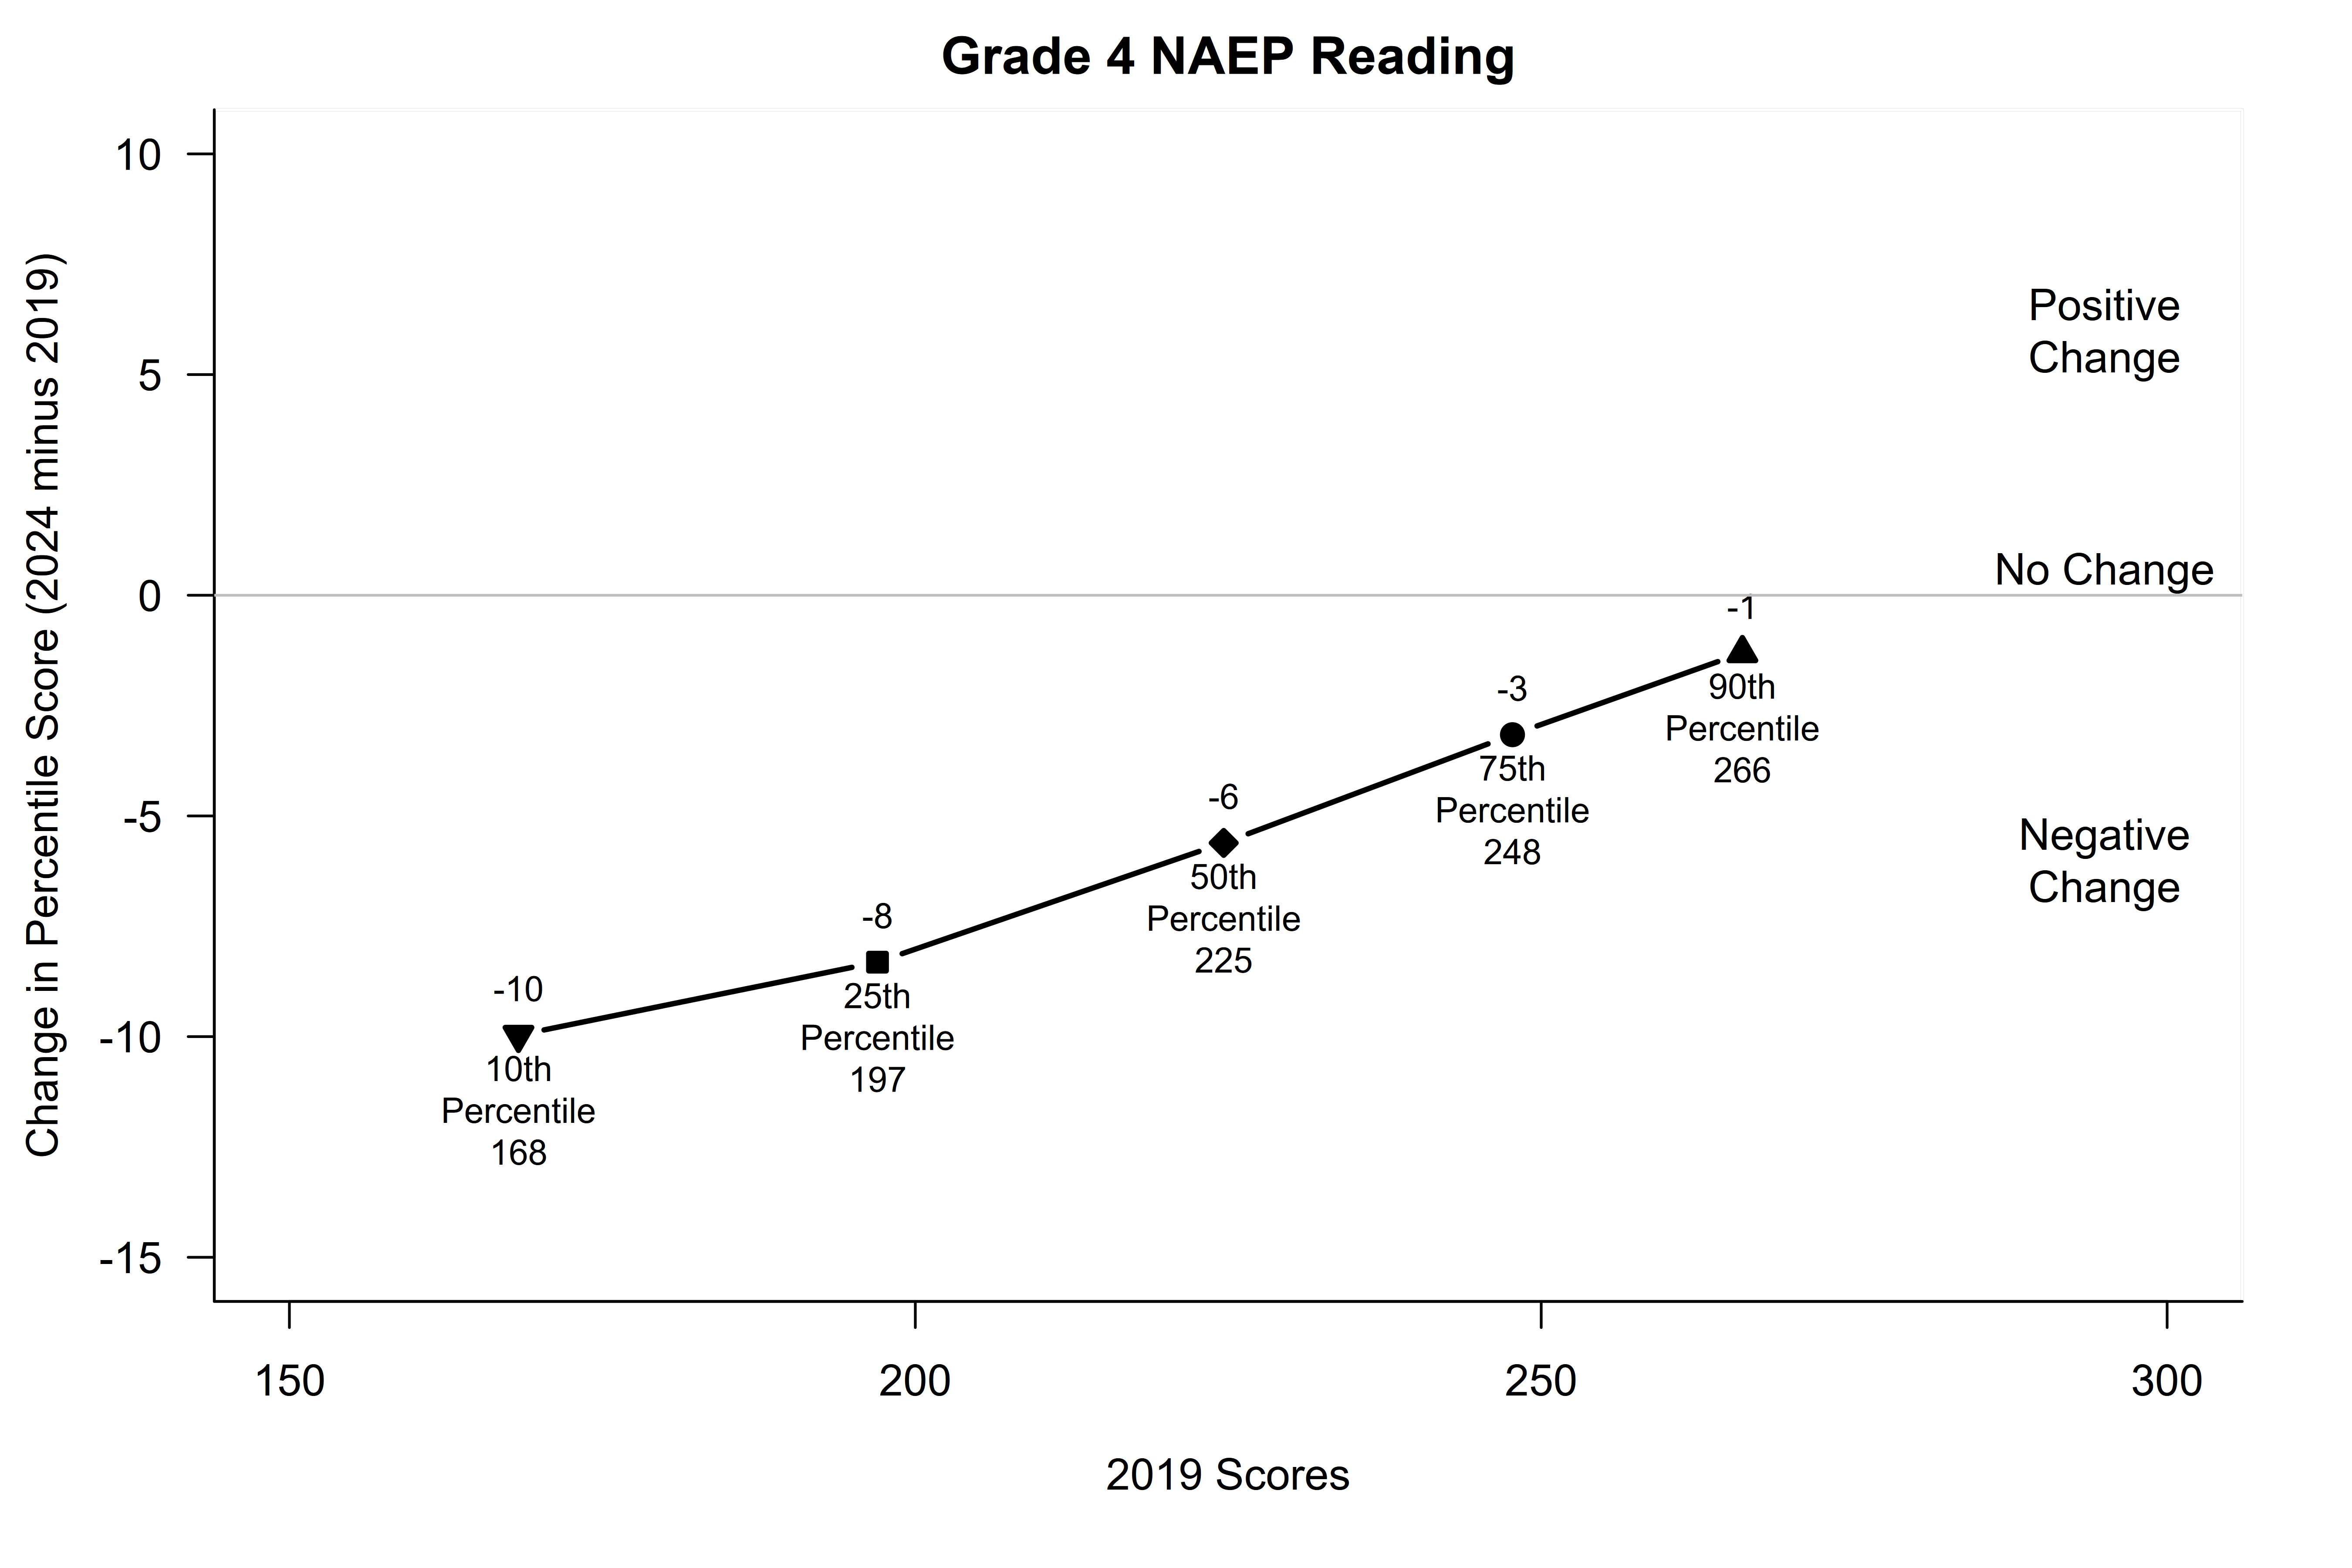
Figura 3. Cambios en las puntuaciones de lectura de NAEP de 4º grado para el país desde 2019 hasta 2024. La línea horizontal en 0 distingue entre cambios positivos y negativos.
Para ver más fácilmente las variaciones en los cambios de puntuación a lo largo del espectro de rendimiento, introducimos una variación en un tipo de gráfico para interpretar tendencias. Como se muestra en la Figura 3, combinamos la comparación de dos distribuciones en la Figura 2 en una sola línea.
A diferencia de los gráficos lineales típicos de los resultados de las evaluaciones que muestran el año de evaluación en el eje horizontal, en nuestro gráfico representamos las puntuaciones de 2019 en varios puntos percentuales del eje horizontal, y los cambios en esos puntos desde 2019 hasta 2024 en el eje vertical. También incluimos una línea horizontal en cero para ayudar a identificar cuándo aumentaron las puntuaciones en ciertos puntos del espectro de logro entre 2019 y 2024 (puntos por encima de la línea cero) frente a las que disminuyeron (puntos por debajo de la línea cero). Los puntos que caen en o cerca de la línea cero indican el mismo o casi el mismo rendimiento en 2024 que antes de la pandemia en 2019. En otras palabras, dichos puntos indican que la cohorte de grado 4 de 2024 está en niveles previos a la pandemia.
Para ayudar a leer el gráfico, observamos que el primer punto de la línea en la Figura 3 está posicionado:
- en 168 en el eje horizontal—correspondiente al percentil 10 en 2019—y
- en -10 en el eje vertical, lo que corresponde a una caída de 10 puntos en el percentil 10 entre 2019 y 2024.
Los otros puntos de la línea en la Figura 3 se determinan de manera similar para cada uno de los puntos percentuales restantes: 25º, 50º, 75º y 90º. Juntos, forman una línea ascendente y inclinada que cuenta la historia del cambio a lo largo del espectro de logro a simple vista. La línea ascendente revela que los alumnos de cuarto curso en Estados Unidos experimentaron una mayor pérdida de lectura en el extremo inferior/izquierdo de la distribución de puntuaciones estudiantiles que en el extremo superior/derecho. Así, mirando más allá del cambio en las puntuaciones medias se revela que las pérdidas variaron a lo largo del espectro de rendimiento y que la disparidad de rendimiento entre estudiantes con bajas y altas puntuaciones se amplió.
¿Qué aprendemos sobre los cambios en las puntuaciones de lectura a lo largo del tiempo en todo el espectro de logro estudiantil comparando algunos estados?
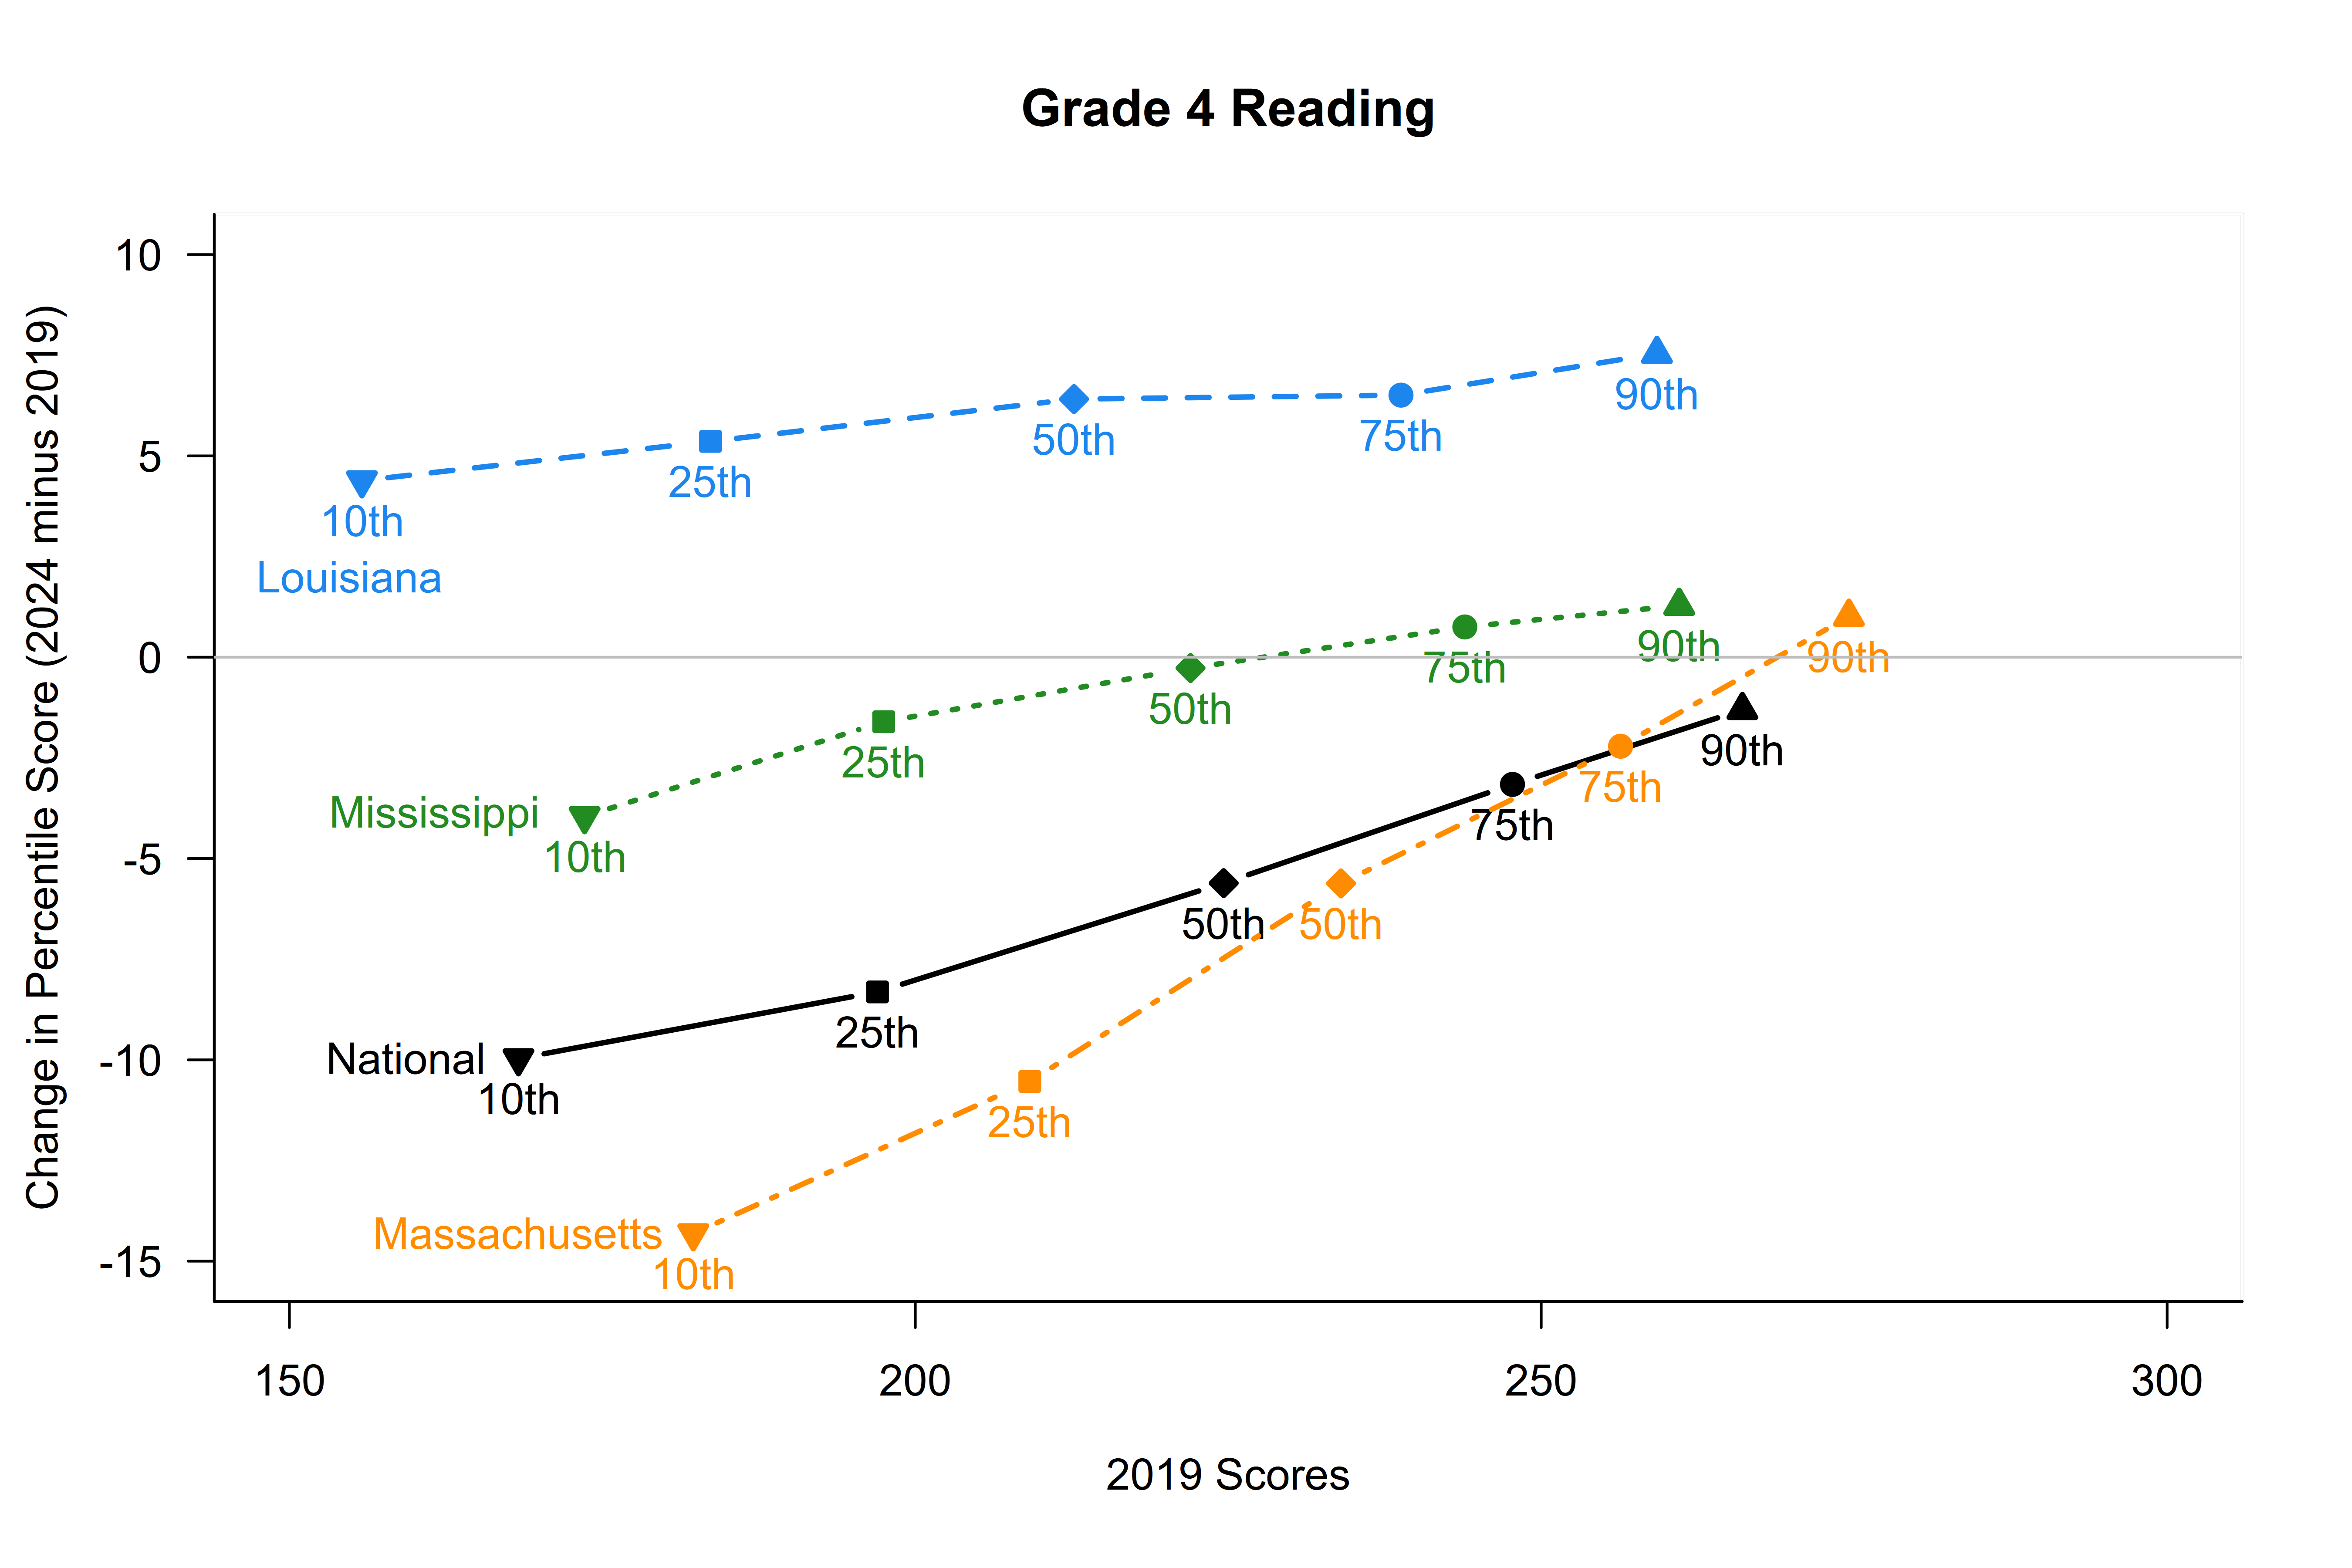
Figura 4. Cambios en las puntuaciones de lectura de NAEP de 4º grado para el país, Luisiana, Mississippi y Massachusetts desde 2019 hasta 2024. La línea horizontal en 0 distingue entre cambios positivos y negativos.
En nuestro anterior blog de investigación ETS, analizamos las puntuaciones de lectura del NAEP para tres estados: un estado que tradicionalmente ha tenido buenos resultados en el NAEP—Massachusetts—y dos estados que no lo han hecho pero han aprobado políticas destinadas a mejorar los niveles de lectura de los estudiantes: Mississippi y Luisiana. La Figura 4 muestra nuestro enfoque de una sola línea para estos tres estados, yuxtapuesto con el país en general.
En la Figura 4, vemos lo siguiente:
- El patrón de apuntar hacia arriba, que indica que se amplian las brechas entre estudiantes con puntuaciones bajas y altas, no es exclusivo del país. También es evidente, en cierta medida, para los tres estados.
- Sin embargo, las líneas para Luisiana y Misisipi son mucho más superficiales o menos pronunciadas, lo que significa que los avances y pérdidas educativas fueron más similares entre los de alto y bajo rendimiento. ¡La línea para Luisiana está por encima de 0 y casi plana! Esto significa que Luisiana pudo recuperar las puntuaciones hasta o más allá de los niveles previos a la pandemia para estudiantes de todo el espectro de logro. Los estudiantes de 4º curso, independientemente de la necesidad o nivel académico, están rindiendo mejor en Luisiana en lectura en 2024 que antes de la pandemia en 2019. Este resultado puede reflejar las reformas de Luisiana en acción.
Las reformas de Misisipi también podrían seguir trabajando para apoyar las necesidades de los estudiantes:
- La línea de Mississippi sigue la línea en negrita del 0, indicando puntuaciones relativamente comparables en 2024 con los niveles previos a la pandemia en todo el espectro de logro.
Por otro lado, aunque Massachusetts tuvo una de las puntuaciones medias más altas en el NAEP de 4º grado en 2024, vemos que:
- Massachusetts tiene la línea más pronunciada, mostrando el cambio más marcado en todo el espectro de logro y una ampliación de la brecha entre estudiantes con baja y alta puntuación en 15 puntos.
¿Cómo se comparan estos estados con todos los demás?
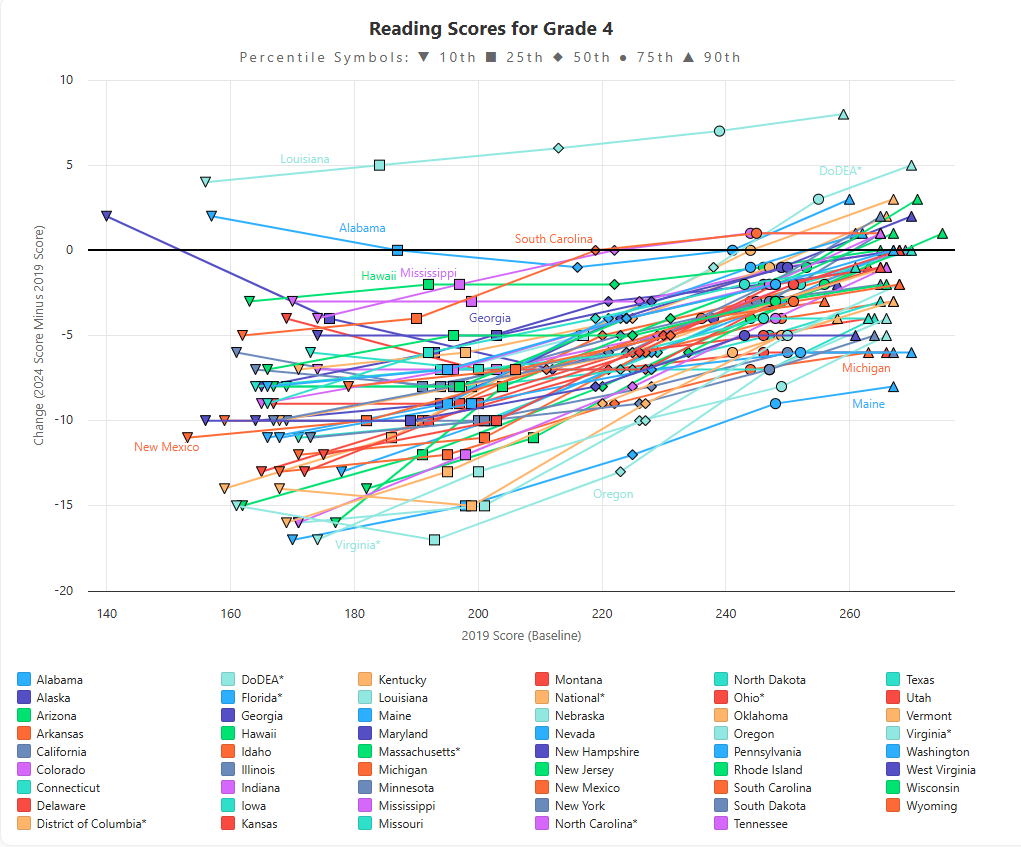
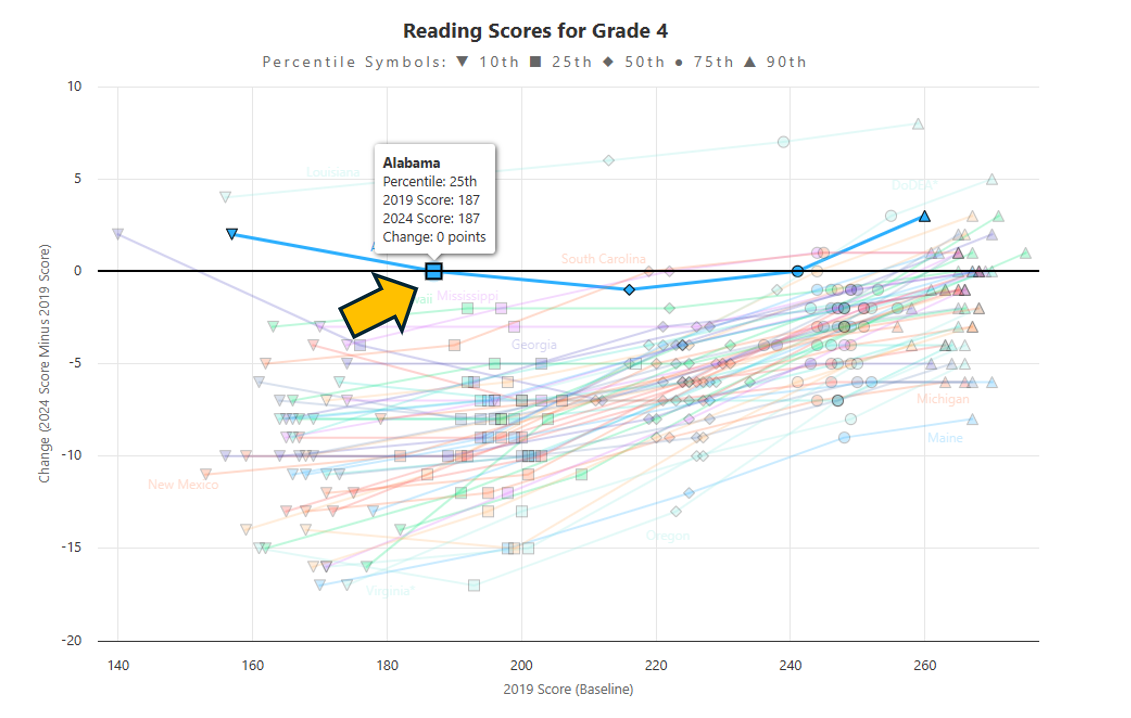
Figura 5. Cambios en los resultados de lectura de NAEP de 4º grado 2019 a 2024 para el país, los 50 estados, el Distrito de Columbia y la Evaluación Educativa del Departamento de Defensa (DoDEA) desde nuestra pantalla interactiva. Una línea horizontal en 0 distingue entre cambios positivos y negativos.
La Figura 5 muestra la vista completa de todos los estados desde nuestra pantalla interactiva para lecturas de 4º curso. Nos muestra que Luisiana es única no solo en comparación con la nación, Misisipi y Massachusetts, ¡sino con todos los estados! La mayoría de los estados tienen líneas ascendentes como Massachusetts y se encuentran completamente o casi completamente por debajo de 0. En otras palabras, la mayoría de los estados aún tienen terreno por recuperar para alcanzar los niveles de puntuación de lectura de 4º curso previos a la pandemia, especialmente para los estudiantes con puntuaciones más bajas.
¡Consulta nuestra exposición interactiva para descubrir más resultados!
¿Cómo se ven estos resultados para la lectura de 8º curso? ¿Y en matemáticas? ¿Qué tal te fue en tu estado? ¡Prueba la pantalla interactiva para encontrar tu historia! ¿Tienes tus propios datos de evaluación? ¡Prueba también este método de trazado entre tiempos con ellos!
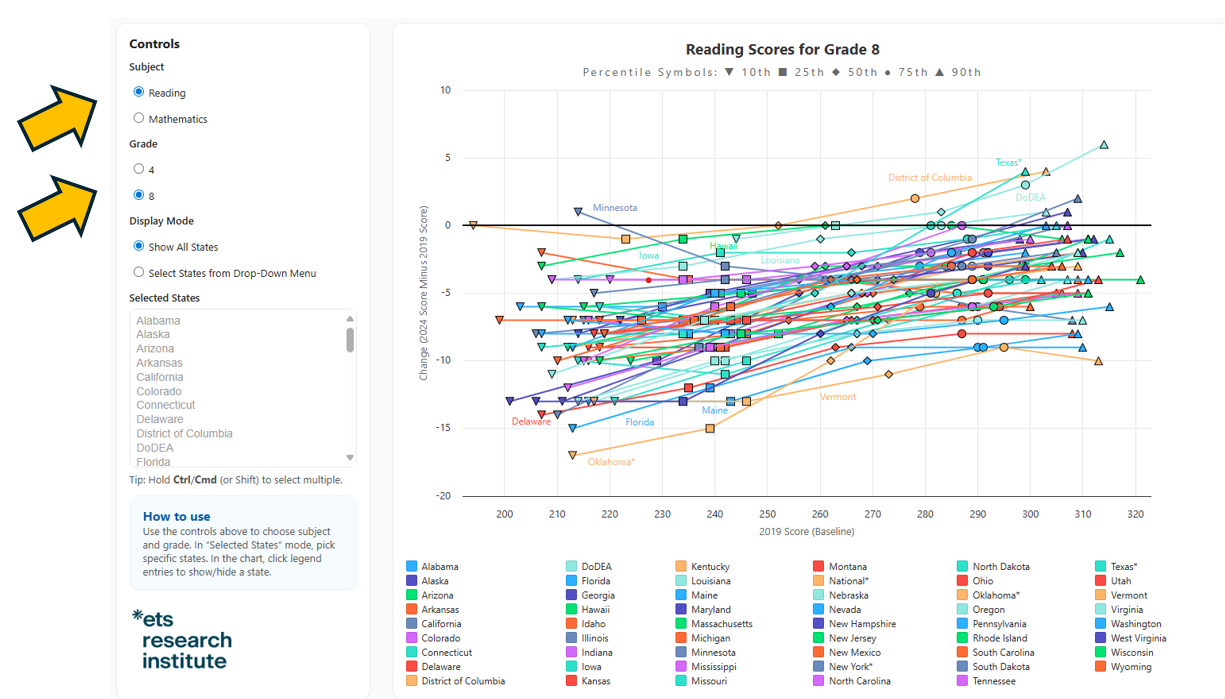
Cómo navegar por la pantalla:
- Utiliza el panel izquierdo de "Controles" para alternar entre lectura o matemáticas y las puntuaciones de 4º o 8º curso.
Utiliza el menú "Controles" de la izquierda para alternar entre ver todos los estados o mostrar estados seleccionados de interés. Mantén pulsada la tecla "Control" para seleccionar más de un estado en el menú desplegable. Mantén pulsada la tecla "Shift" para seleccionar estados listados consecutivamente.
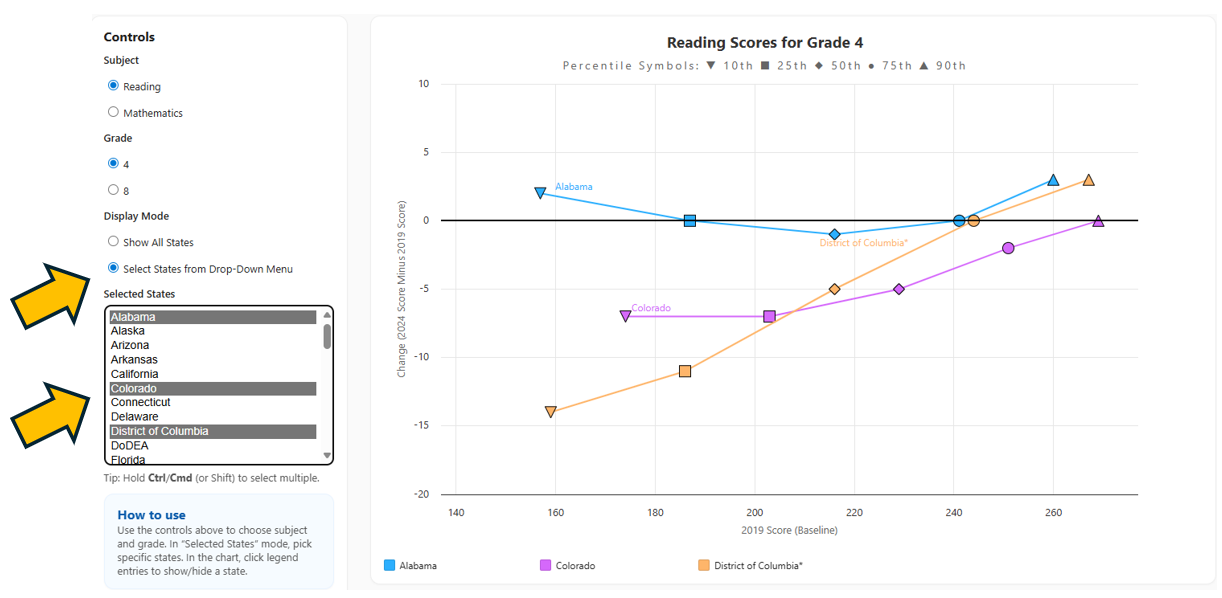
- Pausa sobre un punto de una línea para ver que aparece una caja de vuelo con información sobre el punto de datos, incluyendo el nombre del estado, el percentil seleccionado y el cambio de puntuación en el percentil.
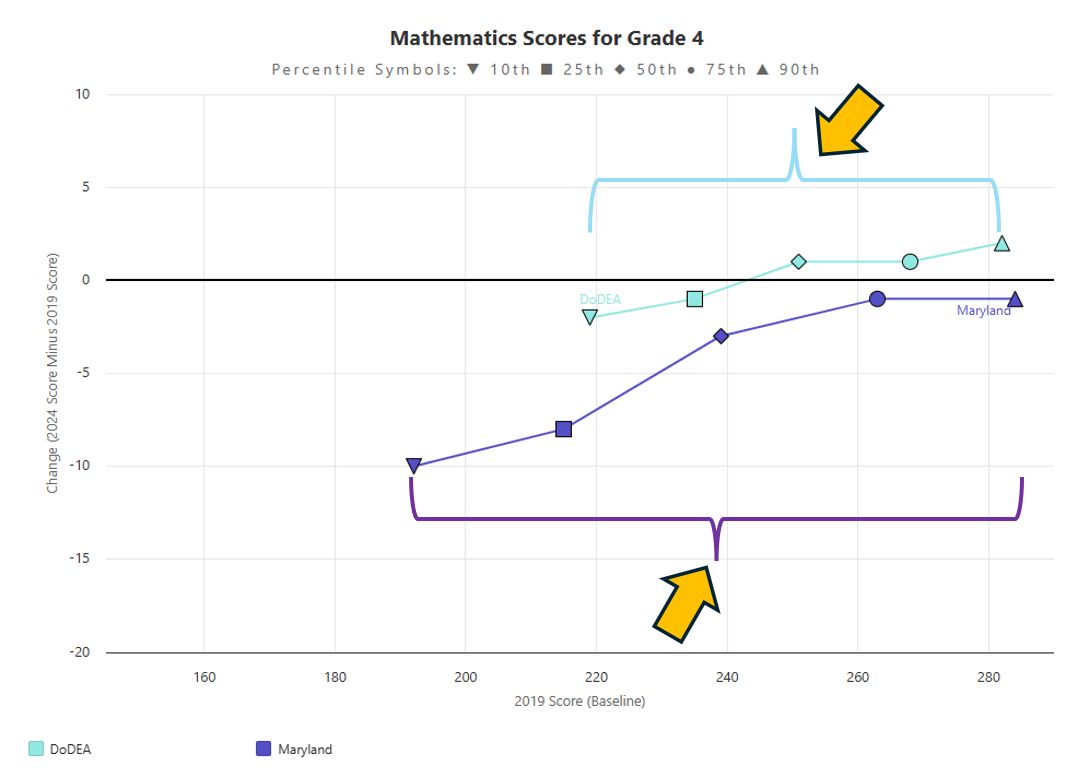
- Fíjate en la posición horizontal de la línea para hacerte una idea del rendimiento base previo a la pandemia en 2019. Por ejemplo, a diferencia de la línea de Virginia, la línea de Puerto Rico en el gráfico de Matemáticas de 4º grado se desplaza mucho más hacia la izquierda, lo que indica un rendimiento relativamente bajo en 2019.
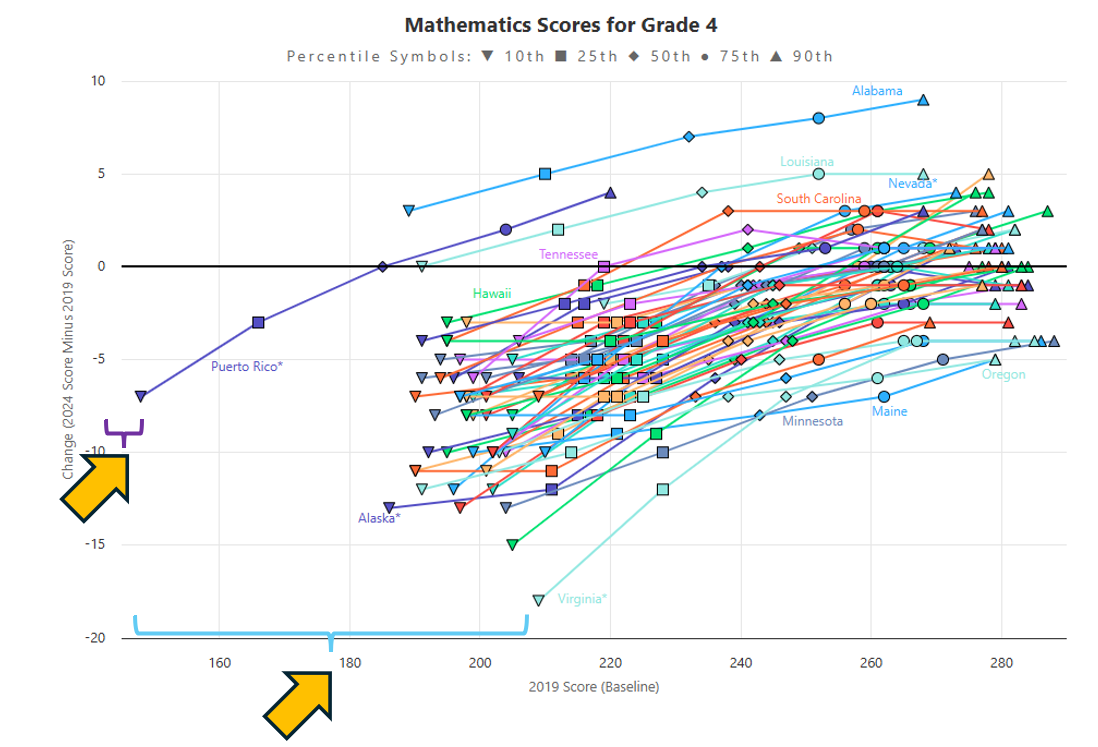
- Fíjate en la longitud de las filas para identificar estados con brechas de rendimiento más pequeñas o mayores entre estudiantes con puntuaciones más bajas y altas en el año base de 2019. Por ejemplo, DoDEA tiene una fila bastante corta para matemáticas de 4º curso frente a la larga fila para Maryland. Los estudiantes con puntuaciones bajas y altas en DoDEA obtuvieron puntuaciones más similares entre sí en 2019 que en Maryland.
Sobre los autores
Katherine E. Castellano, Marisol Kevelson, Emily Kerzabi y Anita Sands trabajan en investigación de evaluación a gran escala y Michael Fauss trabaja en innovaciones en el uso de IA para la seguridad de pruebas en el Instituto de Investigación ETS. Mari es investigadora asociada; Katherine es científica principal de investigación; Emily es gestora de proyectos de investigación; Michael es científico investigador; y Anita es analista principal de investigación en políticas. Los autores también reconocen y agradecen a Nicholas Munyan-Penney (Subdirector de Política P-12 en edtrust) por sus comentarios reflexivos y su revisión de esta entrada del blog.